Understanding Traffic Distribution Metrics
Traffic Distribution Metrics show you how evenly your Knowledge Base traffic is spread across your articles and categories. Think of it like checking whether your content library is a balanced diet o…

Traffic Distribution Metrics show you how evenly your Knowledge Base traffic is spread across your articles and categories. Think of it like checking whether your content library is a balanced diet or if everyone's just binge-eating the same few articles 🍕
What Traffic Concentration Means
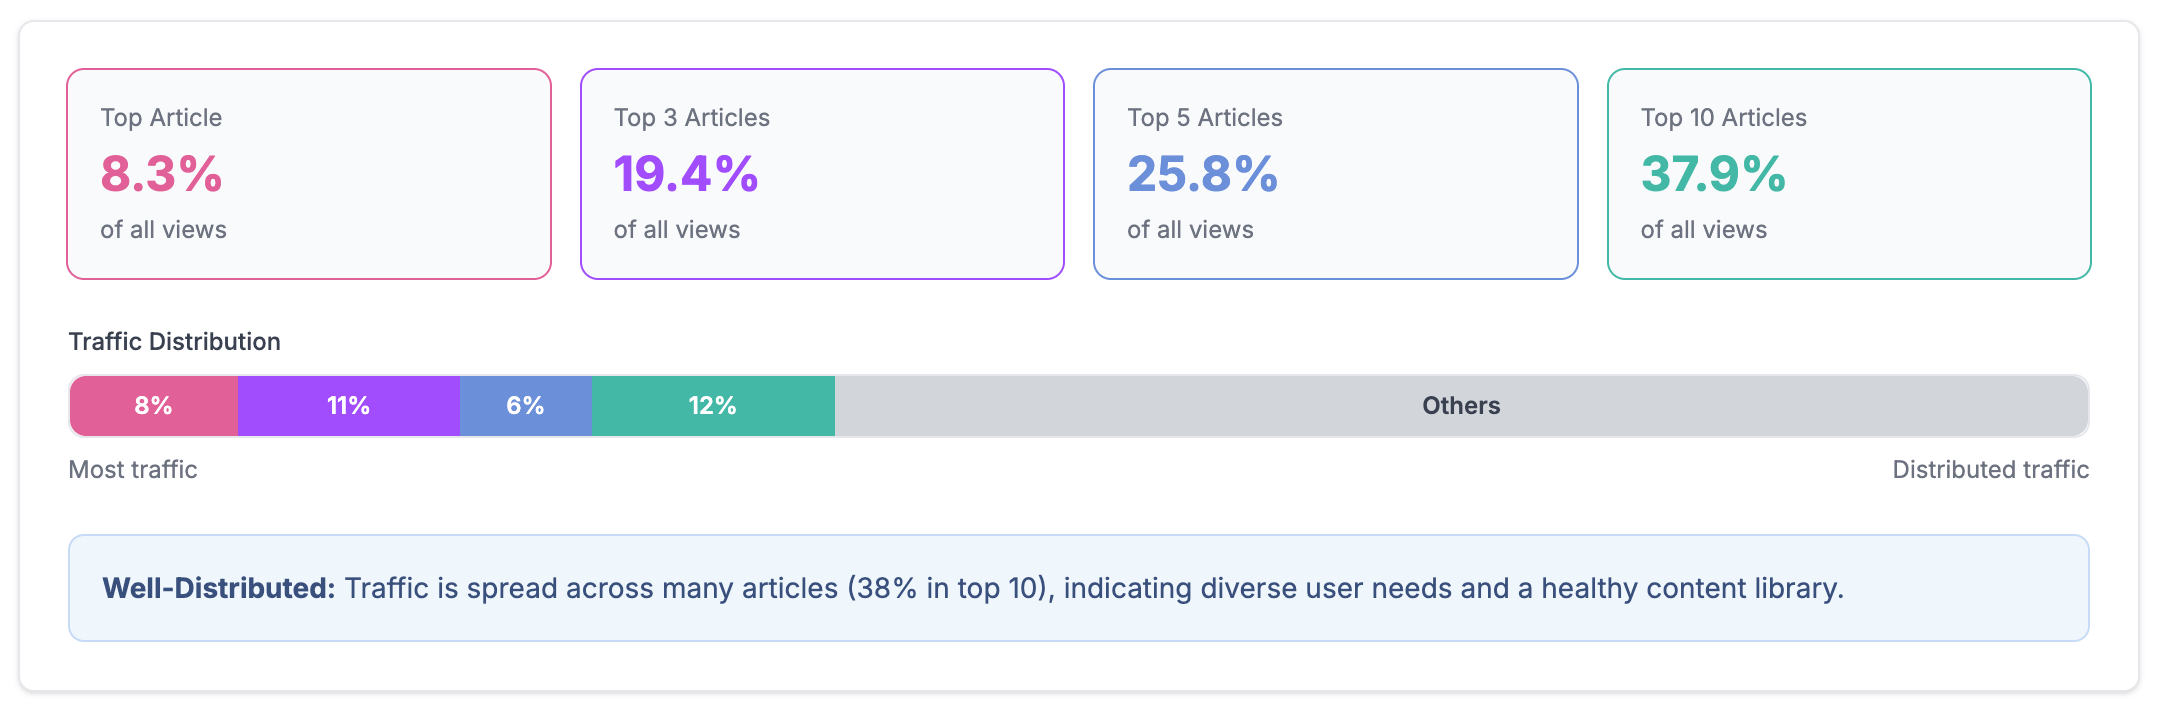
Traffic concentration measures how focused or spread out your visitor activity is. When traffic is highly concentrated, most of your views come from just a handful of articles. When it's well-distributed, visitors are engaging with a broader range of your content.
Why Distributed Traffic is Healthy
The more distributed your content traffic, the better it usually is for your Knowledge Base. Here's why:
- Diverse user needs: Different articles getting traffic means you're covering a wide range of customer questions and problems
- Comprehensive coverage: It shows your content library addresses various aspects of your product or service
- Reduced bottlenecks: Users aren't all funneling through the same few pieces of content
- Better user experience: Customers can find specific answers to their unique situations
Viewing Your Traffic Distribution Details
To get a deeper look at how your traffic is distributed, check out the tables underneath your main metrics. These show you:
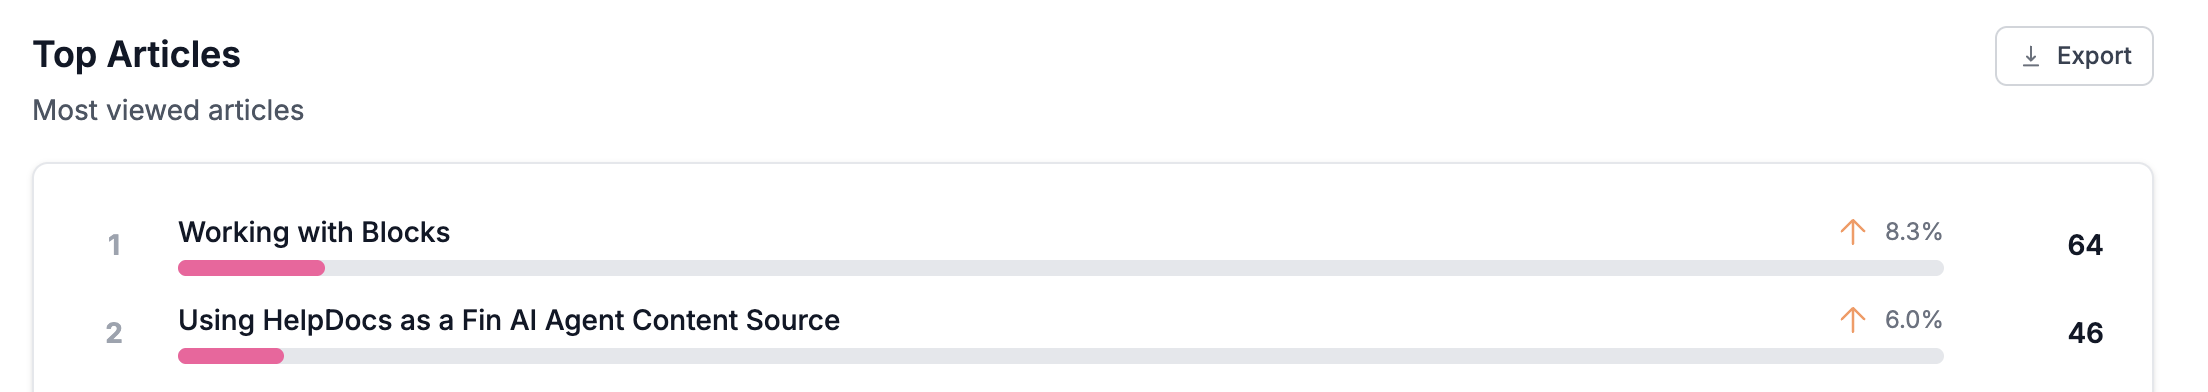
Most Viewed Articles Table
This table ranks your individual articles by view count, helping you identify:
- Your most popular content pieces
- Articles that might need updates due to high traffic
- Content gaps if certain topics dominate your views
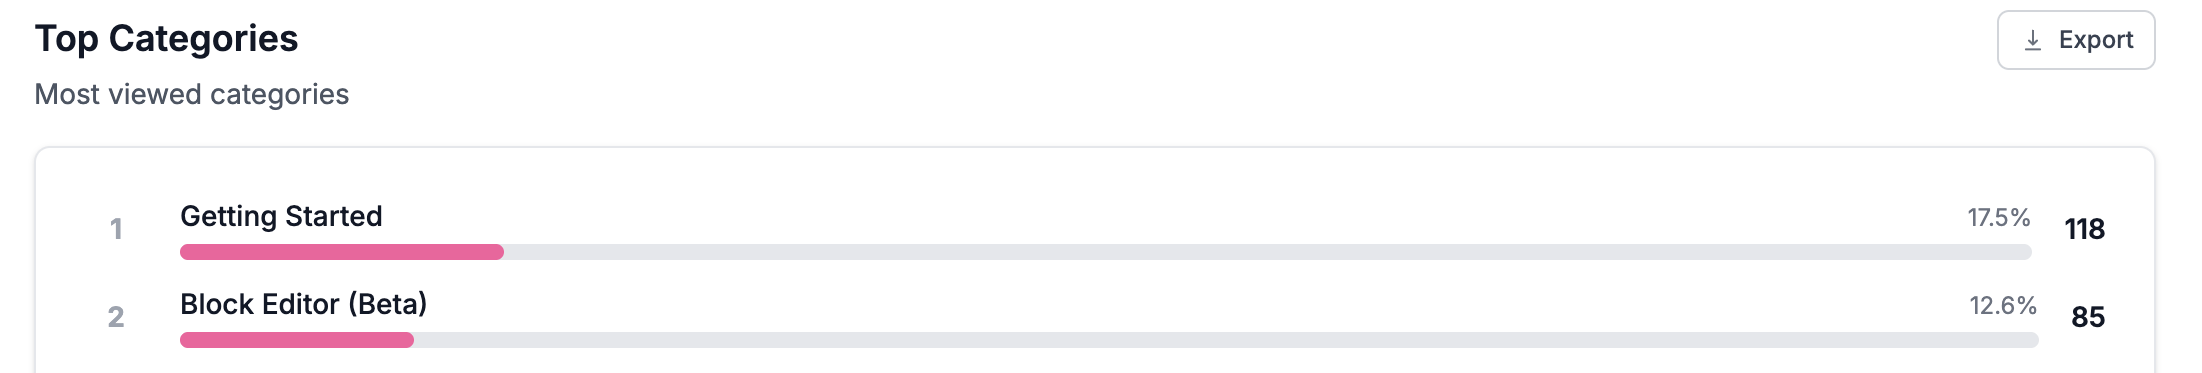
Most Viewed Categories Table
This shows which categories attract the most visitors, giving you insight into:
- The topic areas your customers care about most
- Categories that might benefit from more content
- Overall content strategy direction
Understanding these metrics helps you make informed decisions about content creation, updates, and organization. If you notice traffic is too concentrated, consider promoting lesser-viewed but valuable content or creating more diverse content to better serve your users' needs.
What did you think of this doc?
Exporting Your Stats
Understanding Article Views vs Total Sessions