Understanding Stats
Dive into KB insights: 5 tabs track performance, from tickets avoided to content health.
HelpDocs Stats are organized into five focused tabs—Overview, Feedback, Health, Search, and Content. This makes it easy to understand how your Knowledge Base is performing.
Each tab gives you specific insights so you can quickly find the data you need without scrolling through endless charts.
Navigating Between Tabs
The Stats section lives in your main dashboard navigation. Once you're in Stats you'll see five tabs across the top of the page:
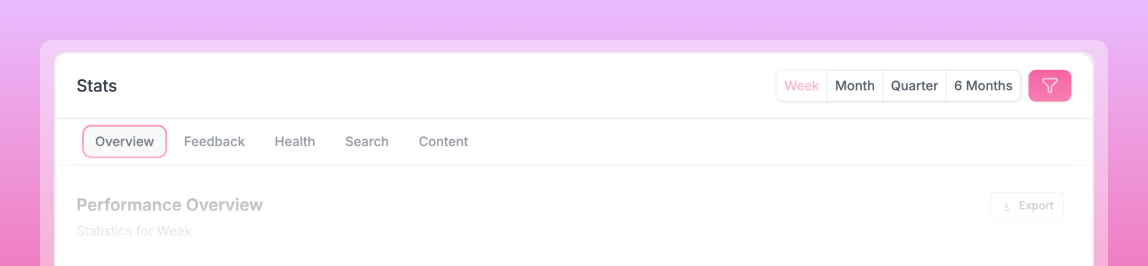
Simply click any tab to switch between different data views. Your current filters will stay applied as you move between tabs. Super handy when you're analyzing a specific time period or category.
What Each Tab Shows You
Tab | What it shows |
Overview | Your birds-eye view of Knowledge Base performance. Here you'll find: Tickets Avoided (how many support queries your docs solved), total sessions and unique visitors, most popular articles and categories, and overall usage trends. Perfect for executive reports or getting a quick pulse check on your docs. |
Feedback | All about what your visitors think of your content: Happiness Score—ranges from 100% (perfect) to -100% (needs work), individual article ratings, and response trends over time. Use this to identify which articles need updating or are performing really well. |
Health | Keeps tabs on your Knowledge Base's overall wellness: article freshness and stale content alerts, search success rates, content gaps where users aren't finding answers, and performance metrics. Great for content maintenance and ensuring your docs stay helpful. |
Search | Everything about how people search your Knowledge Base: most common search terms, failed searches that returned no results, search success rates, and popular vs. unsuccessful queries. Essential for improving discoverability and creating new content based on what people actually want. |
Content | Detailed performance data for your articles and categories: top-performing articles by views, category-level analytics, article engagement metrics, and content usage patterns. Perfect for understanding which content types work best and where to focus your writing efforts. |
How Data Gets Collected and Refreshed
Your Stats update daily (it can take up to 24 hours to show inside your account). We track page views, search queries, feedback responses, and user sessions automatically.
By default, HelpDocs anonymizes IP addresses in analytics to prevent them from being personally identifiable. You'll still receive part of the IP to roughly identify the user's region, but not their exact location. IP anonymization is enabled by default to help with GDPR and ePrivacy compliance.
What did you think of this doc?
Filtering Stats